
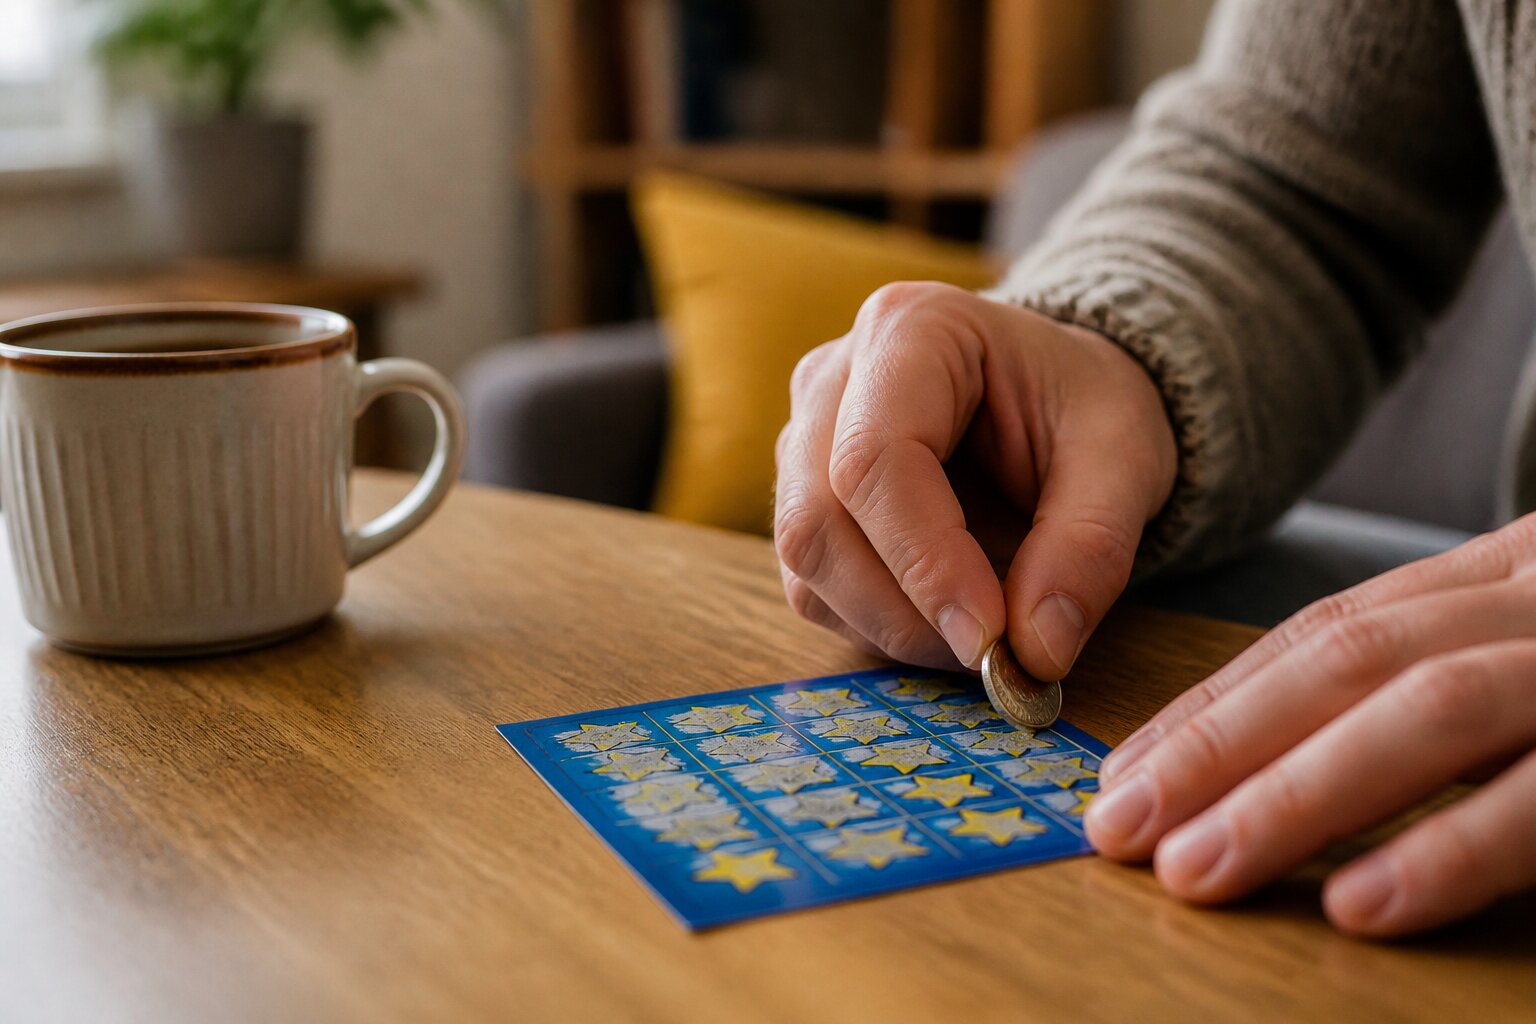
Ever stood at the newsagent’s counter, eyeing up the row of colourful scratch cards and wondered, “Do I actually stand a chance of winning anything on these?” It’s a question many people ask, whether it’s a £1 instant game or a pricier card with a headline prize.
Scratch cards appear in supermarkets, petrol stations and online, each displaying odds or claims about jackpots. Understanding what figures like “1 in 3.5” really mean, and how those numbers are set, makes it easier to decide which games suit you and what to expect when you buy a ticket.
Next, we’ll unpack what those odds represent and how to read them so you can make a more informed choice when you’re picking a card.
What Are Scratch Card Odds?
Scratch card odds show the probability of a ticket being a winner within a particular print run. When you see odds written as “1 in 4”, it means that, on average, one out of every four tickets from that game will carry a prize. Another way of showing the same idea is as a ratio, like “3:1”, or as a percentage: “1 in 4” equals a 25% probability of winning any prize.
These figures are calculated across the entire batch of tickets produced for the game, not just the stock in a single shop. So if 400,000 cards were printed and 100,000 of them were winners, the advertised odds would read as one win in every four tickets overall. That doesn’t tell you which particular ticket you will buy, only the distribution across the whole run.
Odds are a practical guide, not a guarantee. Each ticket has the same statistical chance as every other from that print run, and the advertised numbers help set expectations about how often winners exist in the game rather than promising a particular outcome for an individual.
How Are Winning Odds Worked Out?
Operators calculate odds before distribution, starting with the print run and the prize structure. The game creator decides the number of prizes at each level for a given total of tickets. For example, if 1,000,000 cards are printed and 250,000 are designated to win something, the overall odds work out to 1 in 4 because 1,000,000 divided by 250,000 equals four.
Prizes are not all the same value. A small number of top prizes will be included alongside much larger numbers of low-value prizes. If a £100,000 jackpot appears on only five cards, the specific chance of drawing that top prize would be 1 in 200,000 in a 1,000,000 print run. The positions of winners are randomised at the production stage so there is no predictable pattern to their placement.
Regulators require that the mix of prizes and the randomness of distribution are documented and controlled. Once tickets are in circulation, the statistical odds for any individual card remain the same; they do not alter because some prizes have been claimed. This consistency is what makes the published odds a reliable description of a game’s structure.
Before moving on to how that structure translates into money returned to players, we’ll look at the measures used to express payouts and prize distribution.
Understanding Return to Player (RTP) and Payout Tables
Return to Player (RTP) shows the theoretical percentage of stake money returned to players over a very large number of tickets. For instance, a card with a 70% RTP implies that, across all tickets sold, the game will return £70 for every £100 taken in. RTP is not a promise for any individual player—it’s an aggregate figure for the whole print run.
The payout table complements RTP by listing the number of prizes at each value. For clarity, here is a simple example for a hypothetical £1 card with a 1,000,000-ticket print run:
Prize — Number of Prizes
£1 — 200,000
£5 — 25,000
£20 — 5,000
£1,000 — 3
£100,000 — 1
Those prize counts are multiplied by their values and totalled to calculate the overall payout, which is then compared with the value of all tickets to compute RTP. Using the example above, if prizes sum to £700,000 and the total ticket value is £1,000,000, the RTP is 70%.
Because RTP is an average across all tickets, individual experiences vary widely: some people may win more than their spend, most will win small amounts, and many will win nothing. The payout table gives the clearer picture of how many of each prize actually exist, and how rare the larger prizes are.
What Influences Scratch Card Win Probabilities?
The main determinants of win probability are the size of the print run and the prize structure. If 10,000 tickets are produced and 2,000 carry prizes, the overall odds are 1 in 5. A game that concentrates value into a few top prizes will naturally have longer odds for those prizes, while a card that spreads value across many small prizes will produce more frequent low-value wins.
Game mechanics also matter. Cards with bonus areas, multiple play spaces or special features may change how prizes are presented, often increasing the number of small wins or creating opportunities to combine prizes across sections. These design choices affect the visible frequency of wins without changing the underlying arithmetic of the print run.
Importantly, nothing that happens after production alters the mathematical probabilities: the store location, the timing of purchase or the results on recently bought tickets do not change your statistical chances. The set-up at production governs the rest of the game’s life.
Turning next to the kinds of prizes you’ll encounter, we’ll explain how prize tiers are organised and what they mean in practice.
Types of Awards and Prize Tiers Explained
Prize tiers group awards by value, from small refunds of the stake up to the headline jackpots. Most games favour a distribution with many low-tier prizes and far fewer high-tier wins, so common outcomes are modest amounts while the larger prizes remain rare.
Typical prize levels you might see include:
- £1, £2, £5, £10 and £20 at the lower tiers
- £100 and £1,000 at mid tiers
- £10,000 and £100,000 or more at the top tiers on premium games
Large prizes are often limited to just one or a handful per print run, while the lowest tiers can number in the tens or hundreds of thousands. This balance means most winning tickets fall into the smallest categories.
Can You Win Multiple Prizes on a Single Card?
Some cards have multiple independent play areas, and those can result in several prizes on one ticket. When a game adds multiple winnings together, the total receives a single payout; other games only pay the highest individual prize, so the card’s instructions specify which method applies. Reading the paytable for that particular game clarifies how multiple wins are treated.
What Are the Most Common Prize Amounts?
Low-value payouts such as £1, £2 and £5 are the most common and make up the bulk of wins in most games. These frequent minor wins are the reason many players experience regular small returns rather than occasional large payouts. Understanding this helps set realistic expectations about what typical outcomes look like.
With prize structures explained, it’s useful to clear up several widespread misunderstandings people have about how odds and distribution behave.
Misconceptions About Scratch Card Odds
Several persistent myths can lead to false assumptions about the chances of winning. Below are common misconceptions and the facts that correct them.
Certain shops or areas sell more winners — Distribution is controlled during production and allocation, so no retailer is intrinsically more likely to have winners than another.
There’s a pattern or “hot streak” to buying winners — The outcome for each ticket is fixed within the print run; past results do not influence future ones and there are no repeatable patterns to exploit.
If top prizes have already been won, your odds improve — The advertised odds describe the overall game. Once tickets are circulating, an individual buyer cannot know what remains, so the statistical chance for any given ticket stays as originally set.
“Fresh” packs or new games have better odds — Each ticket is randomised during production, so the position in a pack or the timing of purchase does not alter an individual ticket’s probability.
You can spot a winner by looking closely at the card — Winning information is concealed until revealed and there is no reliable way to detect winners by sight or touch.
These clarifications underline that the numbers provided by game operators are the proper basis for understanding a game’s chances. Next, we’ll look at where those numbers are published so you can find them before you buy.
Where to Find the Odds Information on Scratch Cards
Odds and payout information are commonly available in several places, and checking them helps make an informed choice. Typical sources include:
Card packaging or the reverse side often carries the odds or an RTP figure in small print.
Operator websites publish full paytables and details of prize counts for each game.
Retailers may display posters or leaflets with summary information for games they sell.
Online games include information or “paytable” screens that show RTP and the prize breakdown.
If you want to know how a particular game is structured, looking at the paytable or the operator’s published figures will give the clearest picture. Keep one practical point in mind: checking these details helps you understand the frequency and size of prizes, but it does not change the statistical nature of any single ticket.
Play within your limits and treat scratch cards as entertainment rather than a way to make money. If you’re interested in our recommended games and the most up-to-date paytables, you can view them on this site.
Enjoy Casino Games at Thor Slots
We invite you to enjoy the excitement of casino games with us at Thor Slots. Take things at your own pace and experience entertainment in a way that suits you.
Getting started is simple: create your account, make a deposit and you are ready to play. We look forward to having you with us.
**The information provided in this blog is intended for educational purposes and should not be construed as betting advice or a guarantee of success. Always gamble responsibly.